School enrollment trends across Montana, 2005 to 2019
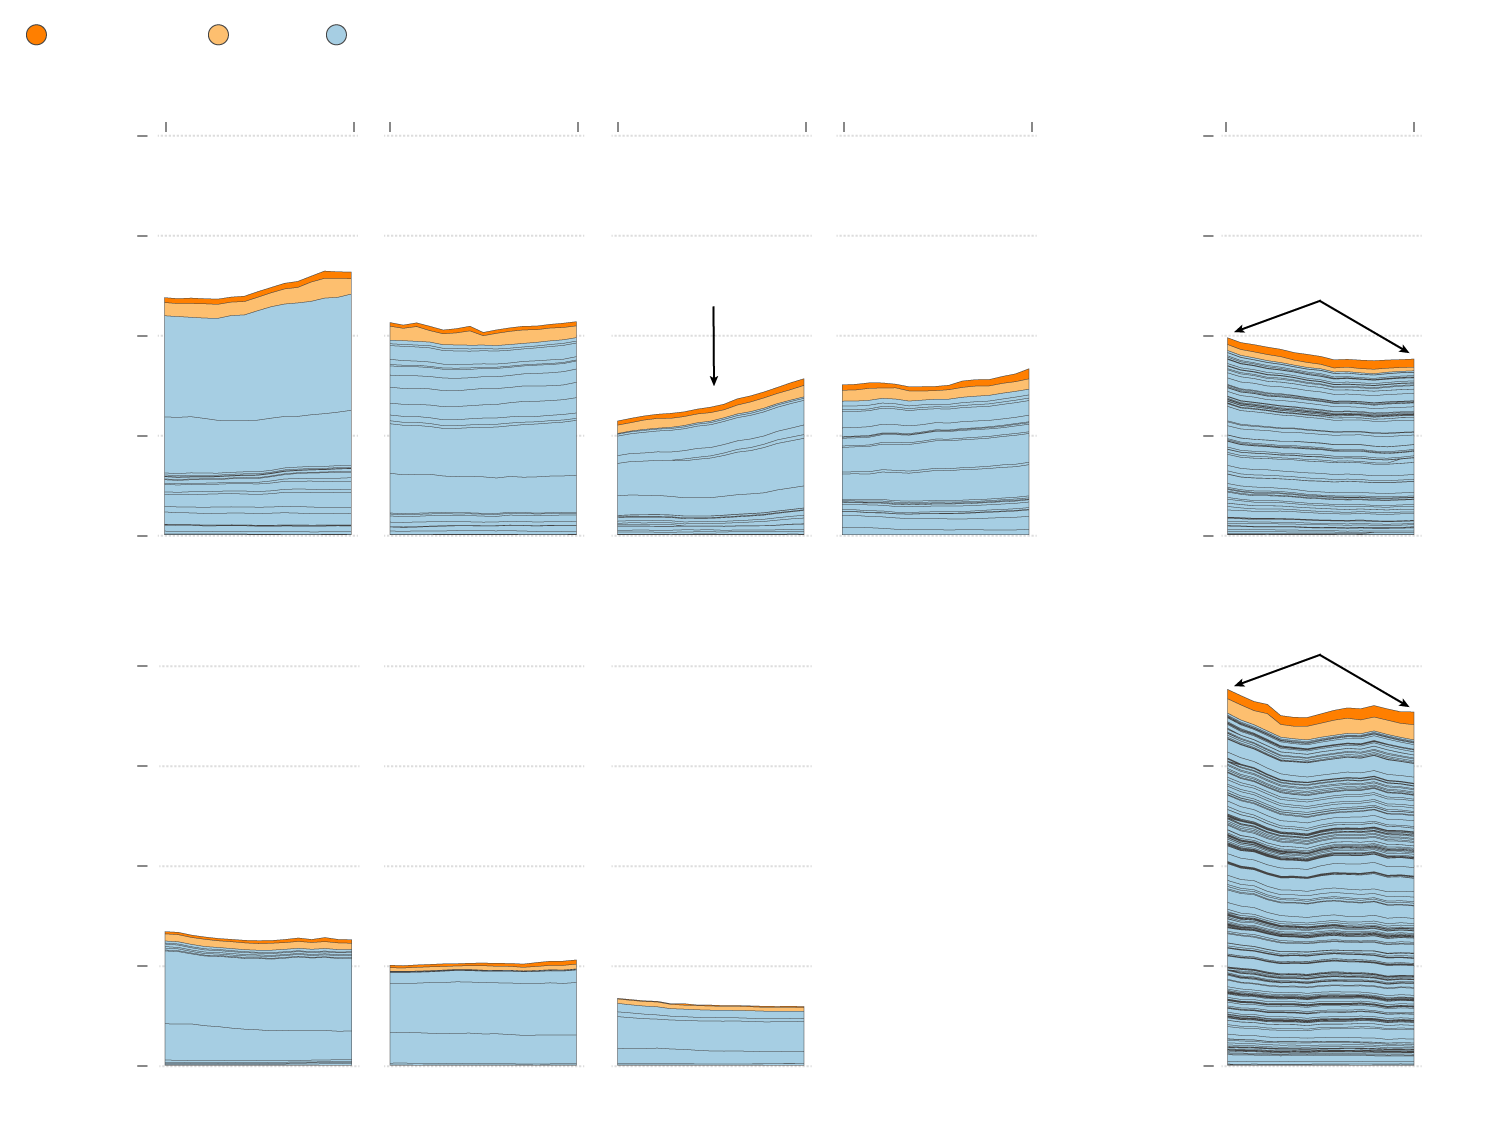
Homeschool
Private
Public school districts
Urban centers
Rural areas
2005
2019
2005
2019
2005
2019
2005
2019
2005
2019
40,000
40,000
students
30,000
30,000
Regional enrollment
Regional enrollment
4,238-student
increase
2,143-student drop
20,000
20,000
Billings Elem.
10,000
10,000
Billings H.S.
Bozeman H.S.
0
0
Yellowstone Co.
(Billings)
Missoula Co./
Ravalli Co.
Gallatin Co.
(Bozeman)
Flathead Co.
(Kalispell)
Rural
Mountains
2,260-student drop
40,000
40,000
30,000
30,000
Regional enrollment
Regional enrollment
20,000
20,000
10,000
10,000
0
0
Cascade Co.
(Great Falls)
Lewis & Clark Co.
(Helena)
Silver Bow Co.
(Butte)
Rural
Plains
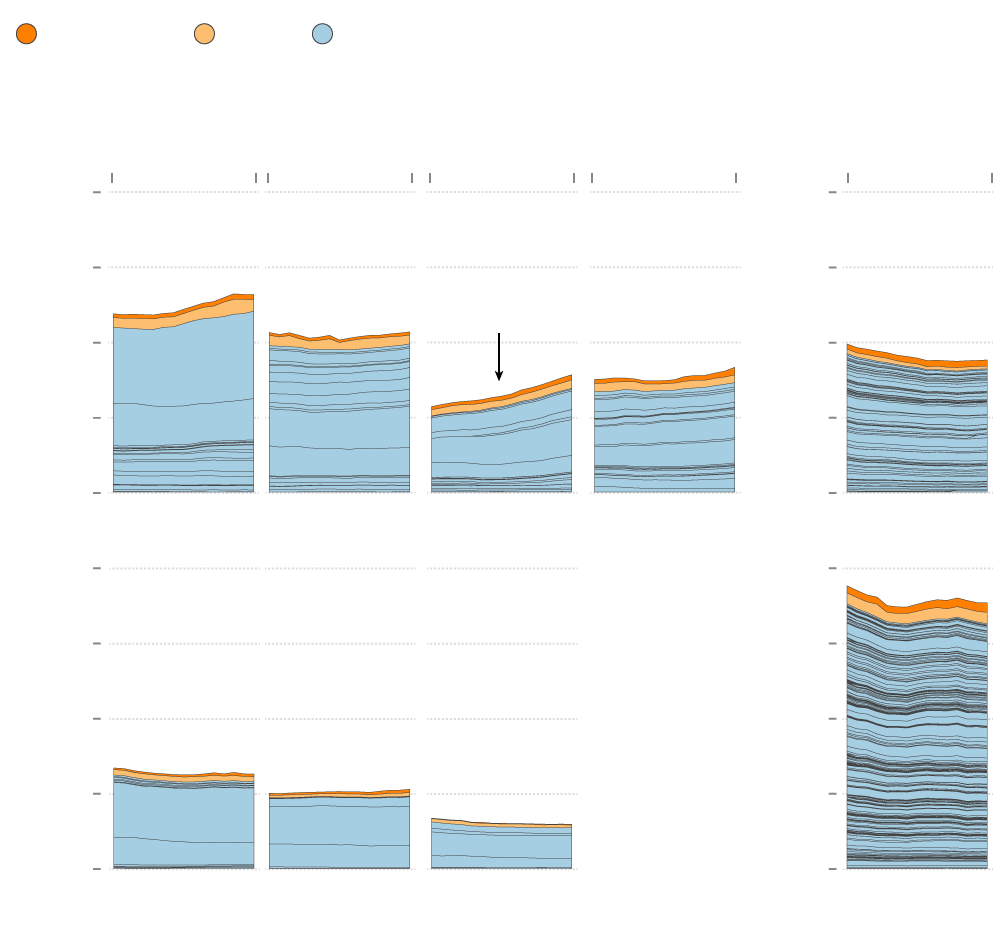
Homeschool
Private
Public school districts
Urban centers
Rural areas
2005
2019
2005
2019
2005
2019
2005
2019
2005
2019
40k
40k
Regional enrollment
Regional enrollment
30k
30k
4,238-student
increase
20k
20k
10k
10k
0
0
Yellowstone Co.
(Billings)
Missoula Co./
Ravalli Co.
Gallatin Co.
(Bozeman)
Flathead Co.
(Kalispell)
Rural
Mountains
40k
40k
Regional enrollment
Regional enrollment
30k
30k
20k
20k
10k
10k
0
0
Cascade Co.
(Great Falls)
Lewis & Clark Co.
(Helena)
Silver Bow Co.
(Butte)
Rural
Plains
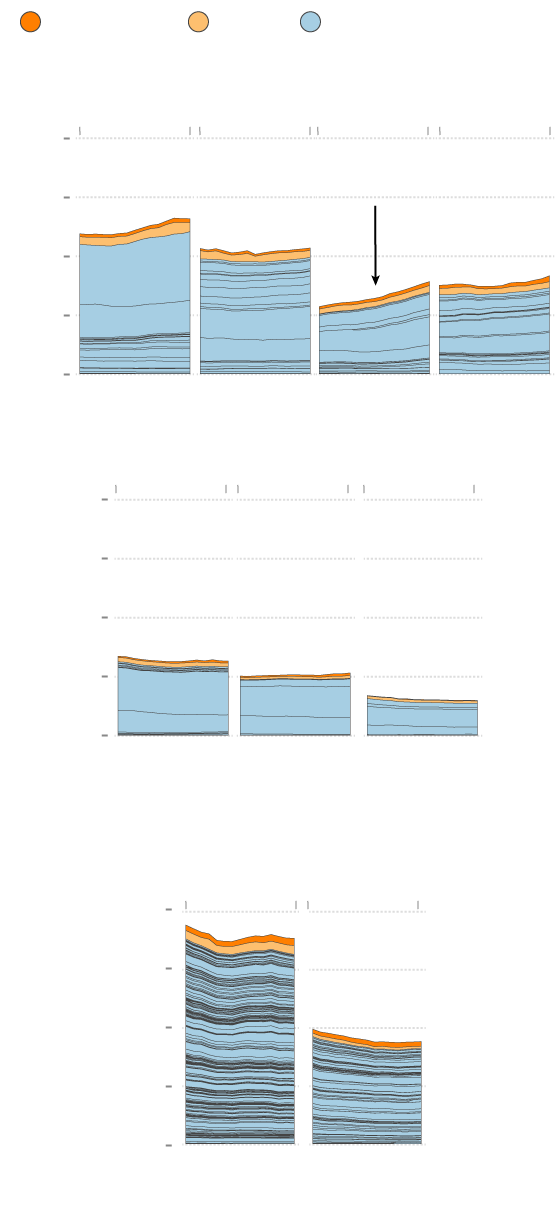
Homeschool
Private
Public school districts
Urban centers
2005
2019
2005
2019
2005
2019
2005
2019
40k
Regional enrollment
4,238-student
increase
30k
20k
10k
0
Yellowstone
(Billings)
Missoula/
Ravalli
Gallatin
(Bozeman)
Flathead
(Kalispell)
2005
2019
2005
2019
2005
2019
40k
Regional enrollment
30k
20k
10k
0
Cascade
(Great Falls)
Lewis &
Clark
(Helena)
Silver Bow
(Butte)
Rural areas
2005
2019
2005
2019
40k
Regional enrollment
30k
20k
10k
0
Rural
Plains
Rural
Mountains